


cartoon courtesy of Wikimedia Commons
There’s no questioning that the stock market is expensive right now. In the past year, two stock groupings that typically indicate market performance, the Dow Jones Industrial Average and the Standard and Poor’s 500 index, have hit record highs. The question on most investor’s minds, however, is not if, but when the market will inevitably come down to earth. The internet is littered with investors and journalists touting indicators of an oncoming recession, and there is a constant stream of articles talking about how a crash or market correction might be imminent.
A lot of the articles are backed up by models and ratios that track the market and can serve as predictors of future market activity.
As of December 7, 2017, Yale Professor Robert J. Shiller’s Price/Earnings ratio of the S&P 500 was about 31.9x earnings compared to the 16.8x historical average, meaning the current Shiller P/E ratio is close to 90% higher than average. Other P/E ratios show a slightly lower increase; the 12 month averaged P/E of the S&P 500 is sitting at around 25x earnings as of December 7th. P/E ratios can be a good indicator of investor demand as well as stock over- or under-valuation; if a stock’s P/E ratio is higher, the stock is trading at a high price even though it has generated lower returns, something most investors would like to avoid.
While no one statistic can accurately represent a market’s health, it is worth mentioning that the previous two times the Shiller P/E was close to this high were during the beginning of the Great Depression and during the year or so leading up to the Dot Com Bubble bursting.
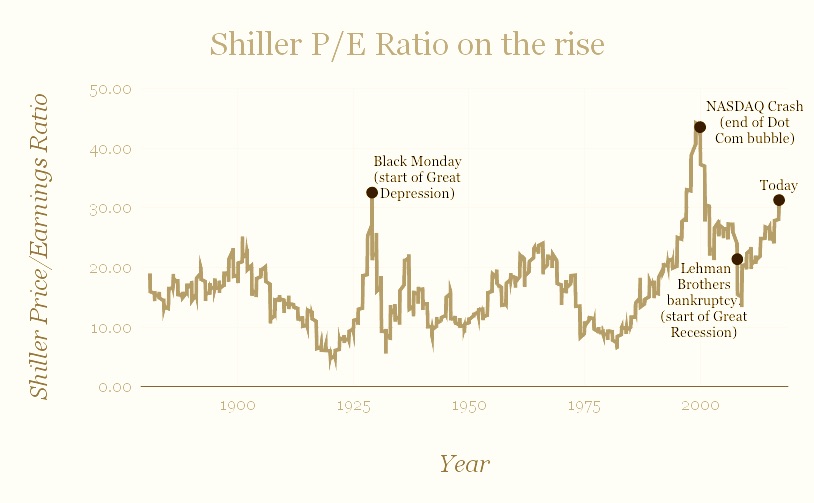
graphic by Tuyva Bergson-Michelson
Despite these correlations, investing websites will caution against putting too much value on P/E ratios. Not only is the economy is really strong right now, but the “Black Tuesday” crash of 1987 , among other similar downturns, had a Shiller P/E ratio well below current levels.
With such a wealth of data at investor’s fingertips, perhaps some of the best advice comes from John Montgomery of Bridgeway Capital Management in his interview with Bloomberg’s Barry Ritholtz on November 3rd, 2017. When asked about the odds of timing the market, he said “It’s not only strongly, it’s incredibly, incredibly strongly against you,” but he expressed that there are “certain things you can do to reduce risk.” One of the risk reducing stratgies Mr. Montgomery promoted was a simple rule to live by: buy and hold. He helped justify the strategy by citing the Behavior Gap. Coined by author and New York Times columnist Carl Richards, the Behavior Gap describes the natural tendency of human beings to sell when they are afraid or when the market is crashing, and to buy when the market is rising.
These snap reactions to market forces can have serious repercussions. Research from groups like Morningstar has found that on average, investors lose about ⅓ of their potential earnings by prematurely buying or selling stocks. This ⅓ discrepancy is the “gap” created by the investor’s behavior. In other words, the average investor earns roughly 66 cents to every dollar that they could have earned by holding on to their investments until they had reached maturity.
Knowledge of the tendencies described by the behavior gap is especially valuable in a market that has seen strong growth over the past 8 years (the average length of such a growth period is around 4-5 years). An average investor, seeing the consistent growth, could easily get greedy and invest a lot of money only to have it all disappear in a downturn.
Later in his interview, Montgomery further affirmed that trying to time the market is usually the wrong move. Mr. Montgomery stated that having a sense that the market will have a downturn and seeing fellow investors growing anxious, “doesn’t mean, however, that I should take that information and time the market — that would be the wrong conclusion.” Even when Mr. Montgomery sees some signs of an overvalued market, he doesn’t act on those instincts because he understands that even experienced investors like himself can fall victim to a desire to “ride the wave” of a market rise and crash.
Equally prescient advice comes from Chris Lord of Criterion Capital Management. When asked about trying to play on short term market forces like crashes and spikes in his interview with the Paper Tiger, he said, “The more important thing is to keep a long term perspective, understand that markets go up and down over time and when they do correct you have been conservative enough with your assets that you can add to investments at attractive prices.” According to Mr. Lord, “What gets people in trouble is when they have too much of their money invested in the market, stocks decline and they can’t handle the pressure of losing a (relatively) large amount of money so they panic and sell at low/bad prices.”
So, at the end of the day what is the average investor to do? Chris Lord offered two recommendations, “if you think that you will enjoy investing and actively monitor your investments then you absolutely should consider buying individual stocks. On the other hand, if you don’t have an inherent interest in markets and the investment process, buying market indices (also known as “Passive Investing”) is the way to go.”
As a simple way to help ensure that adequate capital is on hand to “double down” on investments in the event of a downturn, Mr. Lord explained that, “One good, proven approach is called “Dollar Cost Averaging” where you invest the same dollar amount every month (or every quarter/year). That way [you’re] buying less of a stock when it’s up a lot and buying more shares when the price is down.”